What Is AQI? Latest Air Quality Trends, Global Rankings, and Health Risks
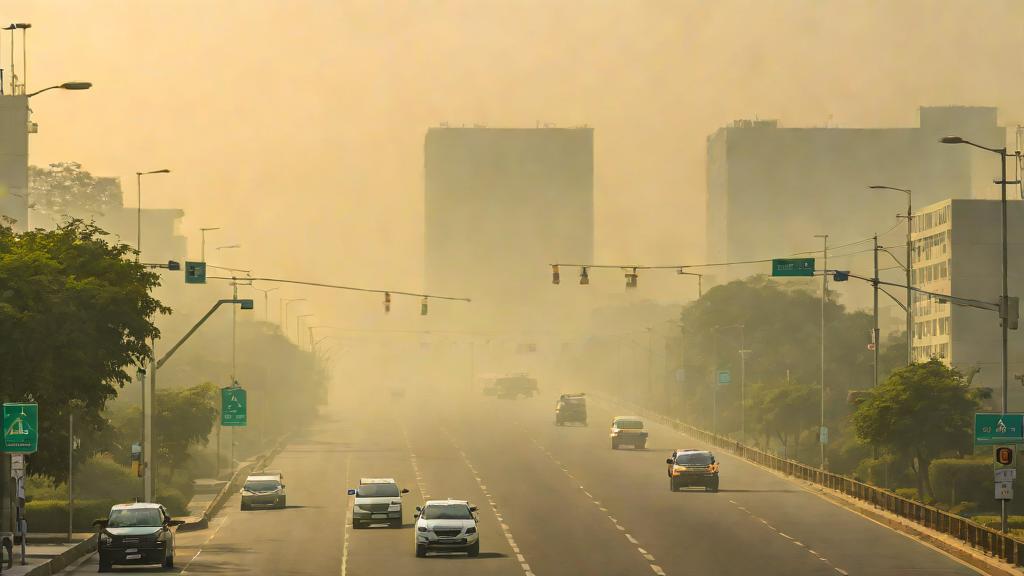
- The Air Quality Index (AQI) measures ground-level atmospheric pollutants like PM2.5, PM10, and ozone to determine public health risks.
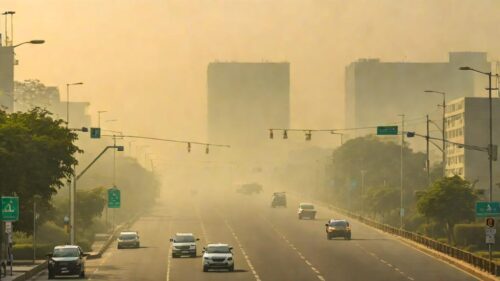
- Latest pollution updates reveal Mumbai currently records the worst air quality in India, surpassing Delhi on national AQI lists.
- International AQI statistics show Singapore surpassing both Delhi and Mumbai among the top 10 cities with the worst air quality in the world.
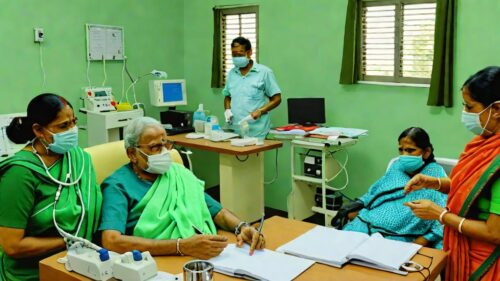
- High AQI environments increase the risk of respiratory illness, heart strain, and lung damage, requiring protective equipment like N95 masks.
The Air Quality Index (AQI) is a standardized numerical system used by environmental agencies to measure daily air quality and communicate potential health risks to the public. A higher AQI value indicates greater atmospheric concentration of harmful pollutants, signaling elevated health dangers for residents. Recent environmental data highlights significant shifts in regional air quality, with Mumbai currently recording the worst AQI figures in India and international reports revealing that cities like Singapore have surpassed both Delhi and Mumbai among the top 10 cities with the worst air quality in the world.
What Does the Air Quality Index (AQI) Measure?
The Air Quality Index translates complex chemical monitoring data into a single, easily understandable numerical score. Environmental regulators collect real-time data on key ground-level pollutants to determine the overall AQI score for a specific geographic location. The primary pollutants tracked in standard AQI assessments include:
- Fine Particulate Matter (PM2.5): Tiny microscopic particles smaller than 2.5 micrometers in diameter that can penetrate deep into human lung tissues and enter the bloodstream.
- Coarse Particulate Matter (PM10): Inhalable dust and smoke particles under 10 micrometers that irritate upper respiratory tracts.
- Ground-level Ozone (O3): A primary component of smog created by chemical reactions between sunlight and industrial emissions.
- Nitrogen Dioxide (NO2): A harmful gas produced predominantly by vehicle exhaust systems and industrial combustion.
- Sulfur Dioxide (SO2): A volatile toxic gas released mainly by fossil fuel power plants and manufacturing facilities.
- Carbon Monoxide (CO): An odorless gas emitted by fuel-burning vehicles and equipment.
When any single pollutant reaches hazardous concentrations, the overall AQI score increases, prompting environmental agencies to issue public health warnings.
Recent Air Quality Trends: Mumbai Tops India’s Pollution List
Recent atmospheric measurements show a surprising shift in regional pollution patterns across South Asia. According to the latest air monitoring reports, Mumbai has officially surpassed Delhi to top India’s air pollution list. AQI readings highlight that Mumbai currently suffers from the worst air quality in the country, creating environmental conditions that make it dangerous to breathe for millions of residents.
Historically, Delhi has been recognized as the most severely polluted urban center in Northern India, especially during autumn and winter months. However, updated AQI figures indicate that deteriorating atmospheric conditions in Mumbai have pushed its pollution levels past those recorded in Delhi. While specific environmental factors contributing to this sharp degradation continue to be analyzed by meteorologists and air quality experts, the immediate health impact on local populations remains a primary concern.
Global AQI Rankings: Surprising Shifts in International Cities
Air quality issues extend far beyond national borders, as evidenced by recent global AQI tracking updates. Comparative international reports evaluating the top 10 cities with the worst air quality in the world reveal noteworthy developments in global pollution hotspots.
In a notable shift recorded by international environmental monitors, Singapore has surpassed both Delhi and Mumbai in top global air quality degradation rankings. While cities in South Asia frequently occupy top positions on worst air pollution lists, recent data confirms that Southeast Asian hubs can also experience severe air quality drops due to localized industrial activity, weather shifts, and transboundary environmental factors. Specific daily numerical AQI totals vary continuously based on wind speed, humidity, and temperature variations.
Understanding standard AQI Categories and Health Risk Levels
To help citizens interpret local environmental reports, standardized AQI scales divide air pollution readings into six distinct health risk categories. Higher numerical ranges correlate directly with increased public health concerns and recommended lifestyle adjustments.
| AQI Numerical Range | Air Quality Category | Health Implications and Guidance |
|---|---|---|
| 0 to 50 | Good | Air quality is satisfactory; air pollution poses little or no risk. |
| 51 to 100 | Moderate | Acceptable air quality; slight concern for extremely sensitive individuals. |
| 101 to 150 | Unhealthy for Sensitive Groups | Members of sensitive groups may experience health effects; general public is unlikely to be affected. |
| 151 to 200 | Unhealthy | Everyone may begin to experience health effects; sensitive groups face more serious impacts. |
| 201 to 300 | Very Unhealthy | Health alert: risk of health effects is increased for the entire population. |
| 301 and above | Hazardous | Health warning of emergency conditions; entire population is likely affected. |
How Does Exposure to High AQI Affect Human Health?
Breathing ambient air with elevated AQI levels poses both immediate acute threats and long-term chronic health challenges. When fine particulate matter and toxic gases enter the respiratory system, they trigger systemic inflammation. Short-term exposure to high AQI environments frequently leads to sore throat, severe coughing, eye irritation, shortness of breath, and fatigue. Prolonged exposure to toxic air significantly raises the risk of developing chronic obstructive pulmonary disease (COPD), heart failure, stroke, and lung infections.
How to Protect Yourself When the Local AQI Is Dangerously High
When official AQI updates report elevated pollution in your area, taking protective measures can reduce severe toxic exposure:
- Check Real-Time AQI Reports: Monitor daily AQI updates through public environmental websites or phone apps before planning outdoor activities.
- Wear Respiratory Protection: Use fitted N95 or KN95 respirator masks when outdoor exposure is unavoidable, as basic cloth masks fail to filter microscopic PM2.5 pollutants.
- Limit Strenuous Outdoor Exercise: Avoid outdoor jogging or heavy physical activity during peak pollution hours to decrease deep lung inhalation of toxins.
- Purify Indoor Air: Keep windows sealed tightly during bad AQI days and run high-efficiency particulate air (HEPA) air purifiers in indoor living spaces.
Sources
Frequently Asked Questions
What is AQI and why is it monitored daily?
The Air Quality Index (AQI) is a standardized scale that converts atmospheric pollutant metrics into a clear number reflecting safety levels. Environmental agencies track AQI daily to warn populations about dangerous air pollution and recommend health protections.
Which city currently has the worst air quality in India?
According to the latest air pollution reports, Mumbai currently holds the worst air quality in India, officially topping the national pollution list and surpassing Delhi's recorded pollution levels.
Has Singapore surpassed Indian cities in worst global air quality rankings?
Yes, recent international air monitoring figures confirm that Singapore has surpassed both Delhi and Mumbai in global rankings listing the top 10 cities with the worst air quality in the world.
What precautions should I take when the AQI is unhealthy?
When local AQI reaches unhealthy levels, stay indoors with windows closed, run HEPA air purifiers, avoid outdoor physical exercise, and wear an N95 or KN95 respirator mask whenever you must go outside.
About The Author