– PEA includes the known underground Mineral Resources –
BACK FORTY PROJECT PEA HIGHLIGHTS:
(All figures in this news release are expressed in US dollars unless indicated otherwise)
- Robust economics: After-tax NPV at a 6% discount rate of $176.3 million (approximately CA$235 million) with 26.1% IRR at long term consensus metal prices including $1,485 per ounce gold
- Significant leverage to gold: After-tax NPV of $316.3 million at a 6% discount rate (approximately CA$422 million) with 37.8% IRR at recent spot prices including $1,998 per ounce gold with gold generating 52% of revenue
- Includes the known underground Mineral Resources at Back Forty, increasing the life of mine to 12 full years
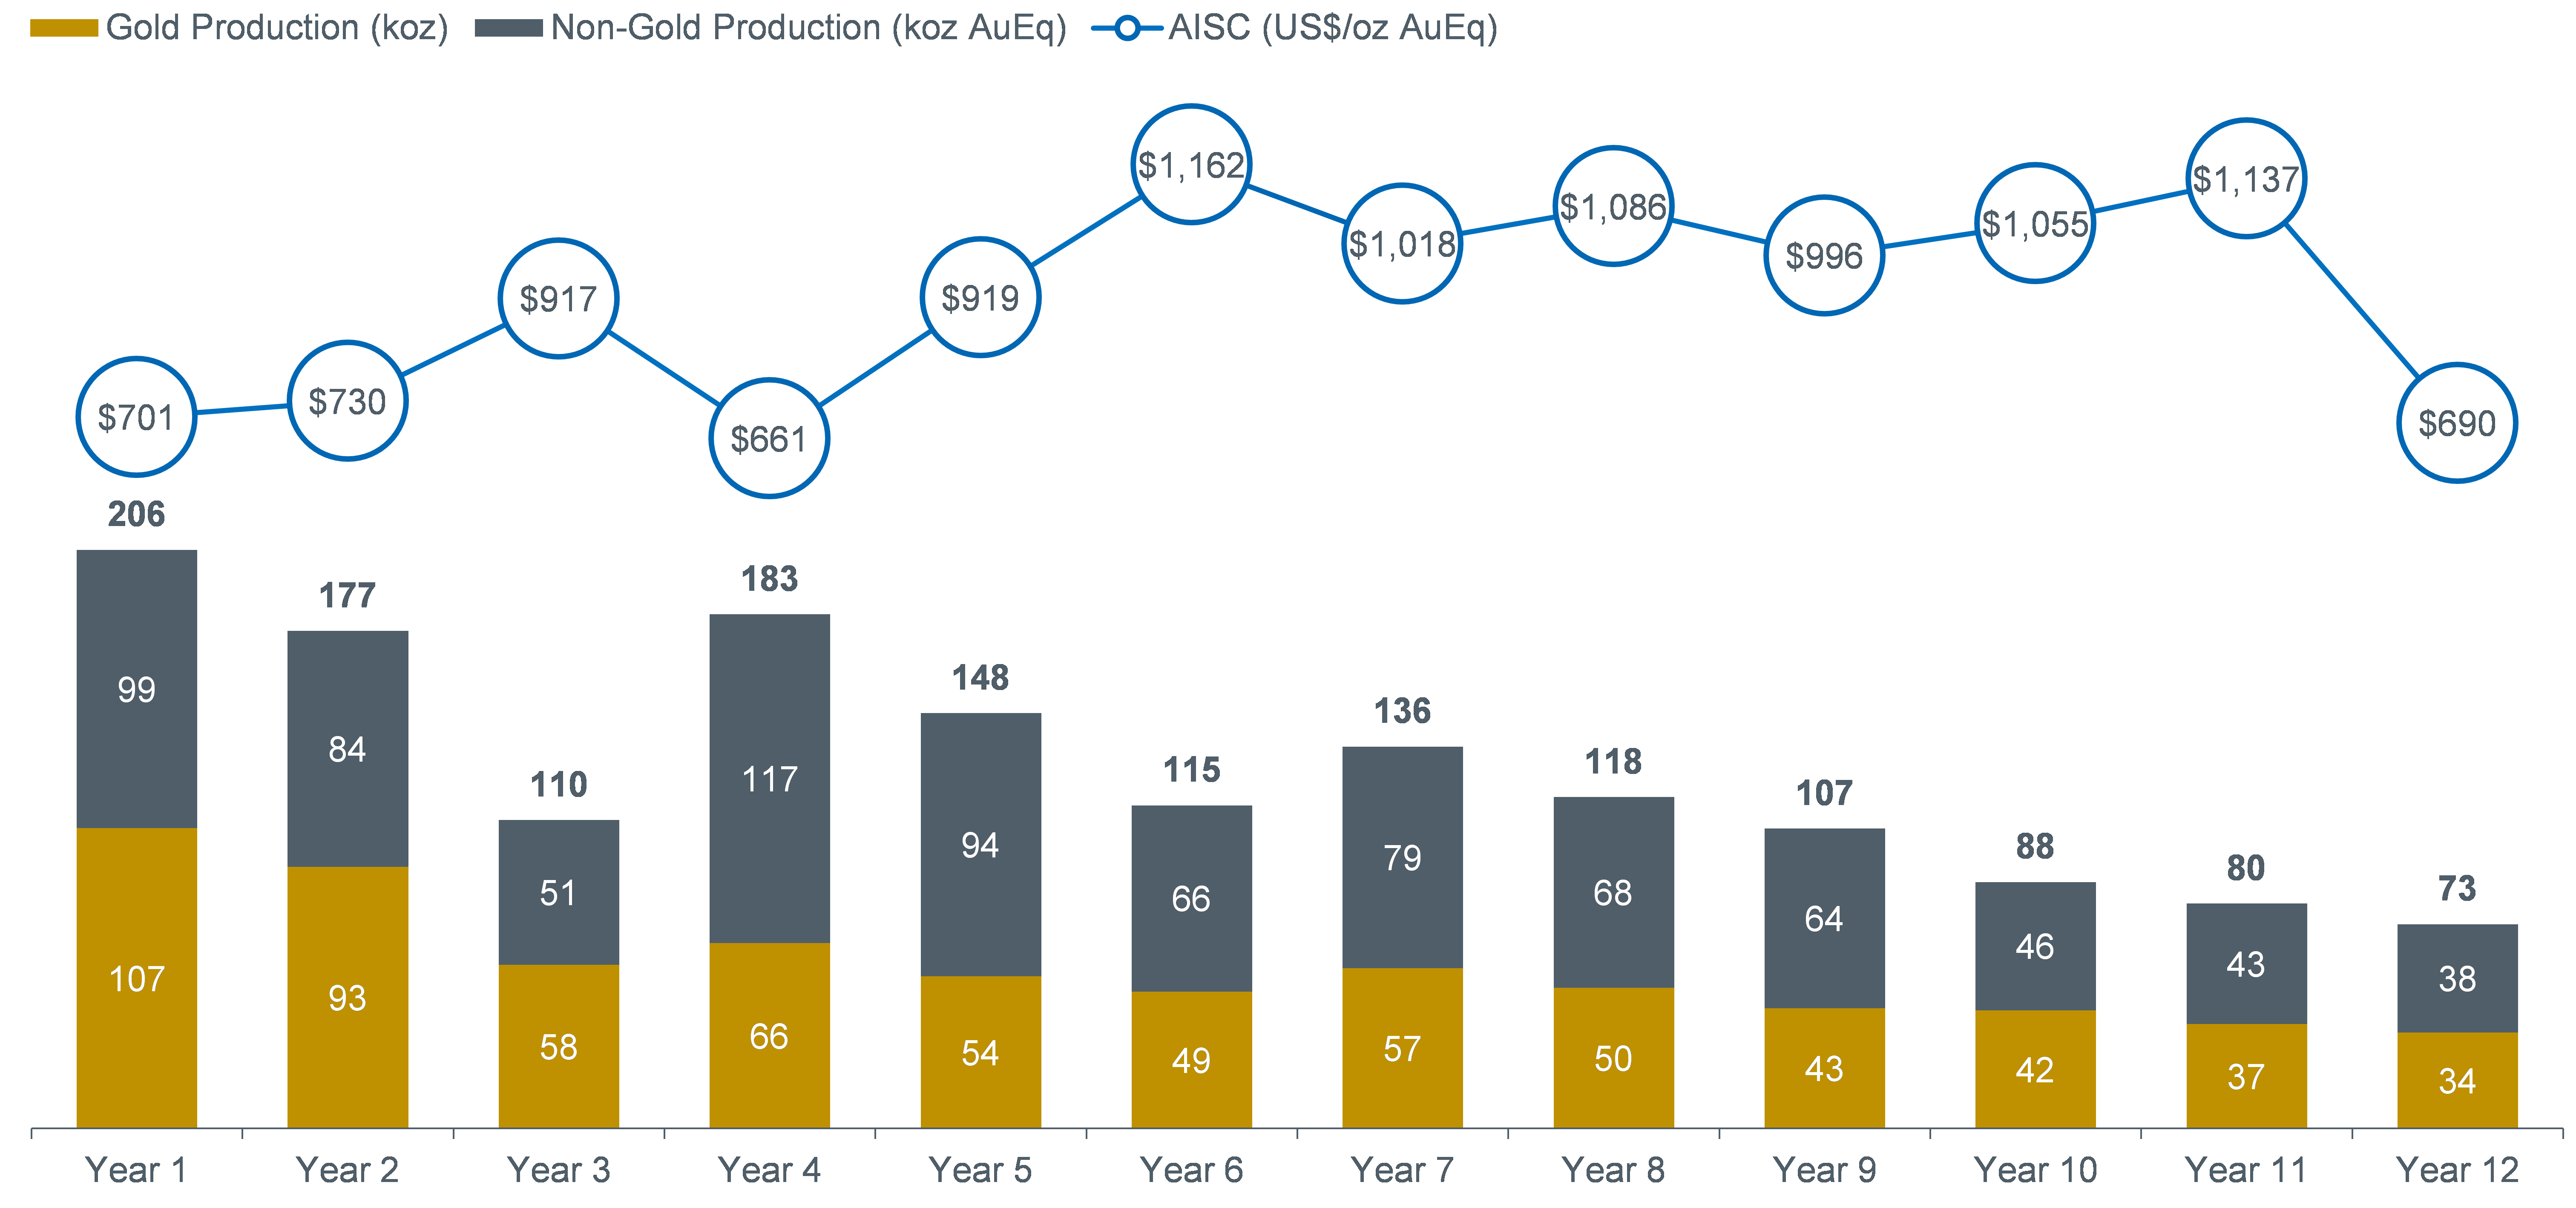
- Life of mine production of over 1.5 million gold equivalent1 ounces with production in Year 1 of 206,000 gold equivalent ounces
- The PEA mine plan consists of open pit mining from Year 1 to Year 5. Underground development will be initiated in Year 5 and underground mining will continue to Year 11. Remaining stockpiles will be processed in Year 12 and a partial Year 13
- Pre-production capital costs of $250.4 million benefitting from significant nearby infrastructure
- Potential value enhancement through additional exploration as the deposit remains open at depth
___________________________________
1 Refer to Note 4 of Table 1 for an overview of the gold equivalent calculation methodology.
![]()
TORONTO–(BUSINESS WIRE)–Aquila Resources Inc. (TSX: AQA, OTCQB: AQARF) (“Aquila” or the “Company”) is pleased to announce results of a positive Preliminary Economic Assessment (“PEA”) for its wholly-owned Back Forty Project (“Back Forty” or the “Project”), located in the Upper Peninsula of Michigan, USA. The PEA demonstrates Back Forty’s value as a high grade, gold-rich project with compelling economics in a Tier 1 jurisdiction. The PEA builds on the Company’s 2018 open pit Feasibility Study and includes the currently known underground Mineral Resources.
Barry Hildred, President & CEO of Aquila, commented, “The completion of the PEA is a significant milestone for Aquila that showcases Back Forty’s potential as a near-term producer in the United States at a time when advanced and substantially de-risked projects are scarce. Back Forty is a well-defined project that also holds tremendous exploration potential. We are excited to commence work on an updated Feasibility Study that we anticipate will be completed next year as we advance the Project through the final stages of pre-construction activities. While doing so, we plan on conducting a drill program at Back Forty to continue to expand the Mineral Resource at-depth where the deposit remains open with numerous targets.”
Aquila will host a webcast to provide a corporate update and review the results of the PEA on Tuesday August 11, 2020 at 12 PM ET / 9 AM PT. See details below.
PEA SUMMARY
The PEA was prepared in accordance with National Instrument 43-101 (“NI 43-101”) by P&E Mining Consultants Inc. in collaboration with Golder Associates Ltd. and Lycopodium Minerals Canada Ltd. The team was led by Andrew Boushy, P.Eng. SVP Capital Projects of Aquila with support from Neil Lincoln, P.Eng. of Lincoln Metallurgical Inc. The Company plans to file the PEA Technical Report (“Technical Report”) on SEDAR at www.sedar.com within 45 days of the date of this news release. The PEA is preliminary in nature, includes Inferred Mineral Resources that are considered too speculative geologically to have the economic considerations applied to them that would enable them to be classified as Mineral Reserves, and there is no certainty that the PEA will be realized. Mineral Resources that are not Mineral Reserves do not have demonstrated economic viability.
TABLE 1 | ||||||
Area | Item | Units | Base Case | Spot | ||
Process Production | Total Process Feed | Million tonnes | 15.9 | |||
Grade | g/t gold equivalent (AuEq)4 | 4.2 g/t | 3.7 g/t | |||
Total Recovery and Payability | % of contained AuEq | 74.3% | 73.4% | |||
Payable Gold | koz gold | 692 | ||||
Payable Gold Equivalent | koz gold equivalent | 1,543 | 1,323 | |||
Annual Gold Equivalent | koz gold equivalent | 128 | 110 | |||
Life of Mine | Years | 12 years | ||||
Throughput | Tonnes per day (t/d) | Nominal 2,800 t/d sulphides + 350 t/d oxides | ||||
Metal Price Deck | Gold | $/oz | $1,485 | $1,998 | ||
Zinc | $/lb | $1.08 | $1.04 | |||
Copper | $/lb | $3.05 | $2.92 | |||
Silver | $/oz | $18.20 | $25.00 | |||
Lead | $/lb | $0.91 | $0.83 | |||
Revenue and OPEX | Gross Revenue | $/t process feed | $132 | $149 | ||
NSR | $/t process feed | $113 | $130 | |||
Total Site Opex | $/t process feed | $52 | ||||
Royalties | % of NSR | 2.0% | 2.1% | |||
EBITDA3 | $/t process feed | $59 | $75 | |||
EBITDA margin | % of EBITDA / NSR | 52% | 58% | |||
C1 Cash Costs (co-product)3 | $/oz gold equivalent | $733 | $854 | |||
C1 Cash Costs (by-product)3 | $/oz gold | $(1,392) | $(1,791) | |||
CAPEX | Initial Capital | $ M | $250.4 | |||
Sustaining Capital | $ M | $214.1 | ||||
AISC (co-product)3 | $/oz gold equivalent | $926 | $1,078 | |||
AISC (by-product)3 | $/oz gold | $(963) | $(1,362) | |||
Unlevered Returns | Pre-Tax NPV 6% discount rate | $ M | $248.3 | $430.3 | ||
Pre-Tax IRR | % | 31.6% | 45.4% | |||
Post-Tax NPV 6% discount rate | $ M | $176.3 | $316.3 | |||
Post-Tax IRR | % | 26.1% | 37.8% | |||
After-tax Payback | years | 2.4 | 1.6 | |||
1. | The Base Case macro-economic forecast assumes flat pricing that has been drawn from the consensus long term estimates of select banks as of July 2020. | |
2. | As at August 4, 2020. | |
3. | None of EBITDA, C1 cash costs or all-in sustaining costs (“AISC”) have a standardized meaning under IFRS. See “Non-IFRS Measures”. | |
4. | Gold equivalent ounces were determined by calculating the total value of metals contained or produced and dividing that number by the gold price ($1,485/oz gold Base Case or $1,998/oz gold Spot Case). As the denominator is higher in the Spot Case, the gold equivalent is lower than at Base Case prices. Gold equivalent grade is calculated by dividing the number of gold equivalent ounces by the Mineral Resource size (tonnes). | |
5. | Project economics reflect the Company’s gold and silver streaming agreements with Osisko Gold Royalties (see Aquila press release dated June 18, 2020). The PEA financial model includes $30 million of initial payments under the gold stream to be received during the design and construction period. The 2018 Feasibility Study did not include the impact of the gold streaming agreement. |
TABLE 2 SENSITIVITY TO GOLD PRICE1 | ||||||
Gold Price ($/oz) | After-tax NPV6% | After-tax IRR | Gold % of Gross Revenue | |||
$1,200 | $83 | 16.9% | 40% | |||
$1,400 | $149 | 23.6% | 43% | |||
$1,600 | $213 | 29.3% | 47% | |||
$1,800 | $277 | 34.6% | 50% | |||
$2,000 | $341 | 39.6% | 52% | |||
$2,200 | $401 | 44.1% | 55% | |||
$2,400 | $460 | 48.5% | 57% | |||
1. | All other metals as Base Case metal prices. |
OPPORTUNITIES
The PEA outlined a number of initiatives that may enhance the Project including:
- Increased gold recovery: There is value in further investigating leaching sulphide flotation tailings to economically recover additional gold. Previous scoping metallurgical test work and cost analysis investigated various options, at a high level, to extract gold from flotation tailings and was favourable at gold prices above $1,600/oz.
- Contract mining: The current mine operations plan is based on an owner-operated mine fleet. Contract mining may be an option to offset initial mine capital costs and mitigate any risks associated with training, operational readiness and the availability of experienced mine personnel.
- Contract process plant operations and maintenance: The current process plant operations plan is based on owner operating and maintaining the process plant. An operations and maintenance contract may be an option to mitigate any risks associated with training, operational readiness and the availability of experienced process plant operators and maintenance personnel.
- Resource confirmation and expansion: Complete additional infill drilling with the objective of step-out drilling to potentially expand Mineral Resources.
WEBCAST DETAILS
Management will host a webcast on Tuesday August 11, 2020 at 12 PM ET / 9 AM PT to provide a corporate update and discuss the PEA. Register for the webcast here. Please send your questions to management at [email protected]. A replay of the webcast will be available on the Company’s website at www.aquilaresources.com.
BACK FORTY PROJECT BACKGROUND
The Back Forty Project is a polymetallic Volcanogenic Massive Sulphide (“VMS”) deposit located in Menominee County, Michigan, USA. The Back Forty Deposit was originally discovered in 2002 and is currently wholly owned by Aquila. The Project is located approximately 55 km south-southeast from Iron Mountain, and approximately 19 km west of Stephenson, Michigan.
A Feasibility Study on the Project was completed in August 2018 that studied open pit mining and on-site processing plants for treating oxide material to produce gold doré and sulphide material to produce zinc, copper, and lead concentrates. The subject of the PEA relates to an expansion of the open pit mining case (Phase 1) by proposing the development of an underground mine (Phase 2) associated with the Project after the open pit phase is complete. It should be noted that the Company has not yet commenced the permitting process for a potential underground expansion.
While the value proposition and operating context for the PEA are similar to the 2018 Feasibility Study, the PEA reflects certain enhancements including:
- As a result of the addition of an underground mine expansion, the oxide and sulphide processing plants were resized to a lower nominal throughput to align them with expected underground mine throughput and to optimize the Project’s economics. The oxide process plant throughput has been reduced from 800 t/d to 350 t/d and the sulphide process plant throughput has been reduced from a nominal 4,000 t/d to 2,800 t/d. The reduction in process plant throughput contributed to a $54 million decrease in initial capital expenditures versus the 2018 Feasibility Study.
- The oxide processing flowsheet was updated to include a SART (sulfidization, acidification, recycling and thickening) plant for optimal doré quality, silver recovery, mercury management, and cyanide management.
- Process plant feed, stockpile management and sulphide process plant change-overs have been optimized to improve operability.
- Additional metallurgical test work has been incorporated to assess blending options and recovery performance and penalties.
- Updated permit conditions have been incorporated, including a double liner leak detection system under all waste rock storage areas and additional contact water storage volume.
MINERAL RESOURCE ESTIMATE
The Mineral Resource Estimate is set out in Table 3 and was prepared by P&E Mining Consultants Inc. The Deposit is well-defined with 94% of the Mineral Resource contained in the Measured and Indicated (“M&I”) classifications. On a gold equivalent basis, the Deposit contains 2.5 million gold equivalent ounces in the M&I classifications at a grade of 4.3 g/t gold equivalent.
TABLE 3 | ||||||||||||||||||||||
Classification | Tonnes | Gold | Gold | Silver | Silver | Copper | Copper | Lead | Lead | Zinc | Zinc | |||||||||||
Open Pit | ||||||||||||||||||||||
Measured | 7,062 | 1.94 | 440.1 | 18.95 | 4,302.0 | 0.34 | 53.51 | 0.14 | 22.1 | 3.02 | 470.1 | |||||||||||
Indicated | 4,341 | 1.75 | 244.7 | 29.67 | 4,140.1 | 0.14 | 13.55 | 0.35 | 33.8 | 1.97 | 188.1 | |||||||||||
M&I | 11,403 | 1.87 | 684.8 | 23.03 | 8,442.0 | 0.27 | 67.05 | 0.22 | 55.9 | 2.62 | 658.2 | |||||||||||
Inferred | 264 | 3.13 | 26.6 | 42.32 | 359.4 | 0.06 | 0.35 | 0.56 | 3.3 | 0.62 | 3.6 | |||||||||||
Underground | ||||||||||||||||||||||
Measured | 1,382 | 2.21 | 98.0 | 25.37 | 1,127.7 | 0.30 | 9.1 | 0.32 | 9.7 | 4.43 | 134.9 | |||||||||||
Indicated | 5,486 | 1.86 | 327.7 | 25.98 | 4,582.8 | 0.42 | 51.2 | 0.32 | 38.2 | 3.53 | 427.3 | |||||||||||
M&I | 6,868 | 1.93 | 425.7 | 25.86 | 5,710.6 | 0.40 | 60.3 | 0.32 | 47.9 | 3.71 | 562.2 | |||||||||||
Inferred | 930 | 3.88 | 116.0 | 51.21 | 1,531.8 | 0.47 | 9.7 | 0.45 | 9.2 | 1.40 | 28.7 | |||||||||||
Total | ||||||||||||||||||||||
Measured | 8,444 | 1.98 | 538.1 | 20.00 | 5,429.7 | 0.34 | 62.6 | 0.17 | 31.8 | 3.25 | 605.0 | |||||||||||
Indicated | 9,827 | 1.81 | 572.4 | 27.61 | 8,722.9 | 0.30 | 64.7 | 0.33 | 72.0 | 2.84 | 615.4 | |||||||||||
M&I | 18,271 | 1.89 | 1,110.4 | 24.09 | 14,152.6 | 0.32 | 127.3 | 0.26 | 103.8 | 3.03 | 1,220.5 | |||||||||||
Inferred | 1,194 | 3.71 | 142.5 | 49.24 | 1,891.2 | 0.38 | 10.1 | 0.47 | 12.5 | 1.23 | 32.3 | |||||||||||
1. | Mineral Resources which are not Mineral Reserves do not have demonstrated economic viability. | |
2. | The estimate of Mineral Resources may be materially affected by environmental, permitting, legal, title, taxation, socio-political, marketing, or other relevant issues. | |
3. | The Inferred Mineral Resource in this estimate has a lower level of confidence than that applied to an Indicated Mineral Resource and must not be converted to a Mineral Reserve. It is reasonably expected that the majority of the Inferred Mineral Resource could be upgraded to an Indicated Mineral Resource with continued exploration. | |
4. | The Mineral Resources in this Technical Report were estimated using the Canadian Institute of Mining, Metallurgy and Petroleum (CIM), CIM Standards on Mineral Resources and Reserves, Definitions and Guidelines prepared by the CIM Standing Committee on Reserve Definitions and adopted by the CIM Council. | |
5. | The Mineral Resource Estimate was based on metal prices of $1,375/oz gold, $22.27/oz silver, $1.10/lb zinc, $3.19/lb copper and $1.15/lb lead. | |
6. | Open pit Mineral Resources were defined within the constraining pit design as per the 2018 Feasibility Study. | |
7. | NSR cut-off values were established for each metallurgical type. Refer to the Technical Report for full details. |
MINING
The Back Forty mine plan presented in the PEA is based on mining the highest value material as soon as possible and treating this material through the process plants to maximize cash flow. This strategy is achieved by mining the mineralized material and either feeding the material directly to the process plant or stockpiling the material on-site for processing later per a feed schedule based on optimal economics for the operation. This plan consists of a combined open pit and underground mining operation. Open pit mining will take place from Year 1 to Year 5. Underground development will be initiated in Year 5 and underground production mining will continue to Year 11.
A series of grade blending stockpiles, by material type, will serve to prioritize the processing of higher-grade material and also manage fluctuations in process plant feed delivery from the two mining operations.
The Back Forty Project area consists of very subdued terrain and topography. The area, topography and climate are amenable to the conventional open pit mining operations proposed for the Project. The open pit mining operation will encompass a single open pit that will be mined with conventional mining equipment in three pushback phases. The underground mine will be developed beneath the open pit with a single decline access point located partway down the open pit main access ramp.
Open Pit Mining
The open pit design is based on the 2018 Feasibility Study design. Minor modifications were made to standardize on 5-metre-high benches with a quadruple bench configuration, resulting in a 20-metre vertical distance between catch berms.
Open pit mining operations will be carried out by Company personnel except for blasting operations. A blasting contractor will be used to supply the explosives, prepare the blasts, charge the holes, fire the blast, and inspect the area post-blast. The equipment fleet will consist of hydraulic excavators and wheel loaders, both with 8 m3 buckets, and 90 t capacity haul trucks, plus track dozers, graders, and support equipment.
A summary of the open pit mining schedule is shown in Table 4.
TABLE 4 | ||||||||||||||||
Type | Units | Total | Year | |||||||||||||
Y-1 | Y1 | Y2 | Y3 | Y4 | Y5 | |||||||||||
Overburden | kt | 3,778 | 1,233 | 1,648 | 896 | – | – | – | ||||||||
Waste Rock | kt | 47,970 | 1,568 | 9,263 | 12,130 | 13,437 | 10,512 | 1,058 | ||||||||
Total Waste | kt | 51,747 | 2,801 | 10,911 | 13,027 | 13,437 | 10,512 | 1,058 | ||||||||
Process Plant Feed Mining | ||||||||||||||||
Total Sulphide | kt | 8,815 | 73 | 2,236 | 1,647 | 1,406 | 2,678 | 776 | ||||||||
Total Oxide | kt | 1,317 | 126 | 353 | 327 | 157 | 309 | 45 | ||||||||
Total Feed | kt | 10,132 | 199 | 2,589 | 1,974 | 1,563 | 2,987 | 821 | ||||||||
Total Material | kt | 61,880 | 3,000 | 13,500 | 15,000 | 15,000 | 13,500 | 1,879 | ||||||||
Strip ratio | w:o | 5.1 | 14.1 | 4.2 | 6.6 | 8.6 | 3.5 | 1.3 | ||||||||
Feed to Stockpiles | kt | 6,961 | 199 | 1,995 | 1,609 | 575 | 1,953 | 629 | ||||||||
Underground Mining
Extraction of the underground Mineral Resource will be achieved by a combination of mechanized Cut and Fill (“CF”) or Longhole (“LH”) methods. CF mining is the dominant method, producing approximately 63% of mined tonnes, with LH producing the remaining 37% of tonnes. CF mining uses one of four stope sizes, and targets flatter-dipping material (dip less than 55°). LH mining uses one of two stope size subsets and orientations (transverse or longitudinal). The weighted average direct mining cost is $33/tonne.
The underground mine begins construction and development in Year 5 with commercial production achieved in Year 6. The production rate of the underground varies depending on development requirements, with a commercial production rate of 2,300 t/d, increasing to a maximum of 3,200 t/d in Year 7.
Table 5 shows the production tonnes from the Back Forty underground deposit by year and mining method.
TABLE 5 | ||||||||||||||||
Type | Year | Year | Year | Year | Year | Year | Year | Total | ||||||||
LH | – | – | – | – | 438 | 968 | 732 | 2,138 | ||||||||
CF Type 1 | – | 98 | 503 | 520 | 268 | – | – | 1,389 | ||||||||
CF Type 2 | 119 | 551 | 558 | 536 | 232 | – | – | 1,996 | ||||||||
CF Type 3 | 1 | 18 | 43 | 47 | 13 | – | – | 122 | ||||||||
CF Type 4 | 1 | 16 | 22 | 24 | 8 | – | – | 72 | ||||||||
Total | 122 | 683 | 1,126 | 1,126 | 959 | 968 | 732 | 5,717 | ||||||||
MINERAL PROCESSING AND METALLURGY
Oxide mineralized material and sulphide mineralized material (Main, Pinwheel and Tuff material) will be treated through separate process plants.
The oxide mineralized material will be processed via a cyanidation leach circuit to produce doré. Depending on the grades of copper, zinc and lead, the sulphide mineralized material will be processed via two stages of flotation to produce concentrates, i.e. either a copper and zinc concentrate, or a lead and zinc concentrate.
Sulphide mineralized material will be processed on a campaign basis based on the main material types that have a similar metallurgical response. As such the design of the sulphide process plant is based on a flexible metallurgical flowsheet to process the main material types.
The oxide process plant has been designed for a throughput of 350 t/d. The overall flowsheet includes the following steps:
- Three stage crushing using an open circuit jaw crusher, open-circuit secondary cone crusher and closed-circuit tertiary cone crusher.
- Grinding and classification.
- Pre-leach thickening.
- Cyanide leach.
- Vacuum filtration of leaching tailings.
- SART.
- Carbon-in-Column gold adsorption.
- Carbon acid-washing, desorption and recovery.
- Smelting to produce doré.
- Cyanide destruction of the final wash filtrate from the vacuum filtration step.
- Tailings repulping and disposal to the Tailings Management Facility (“TMF”).
The sulphide process plant has been designed for a nominal throughput of 2,800 t/d. The overall flowsheet includes the following steps:
- Primary crushing.
- Coarse mineralized material stockpile and reclaim.
- Grinding and classification.
- Gravity concentration.
- Bulk rougher flotation to produce copper concentrate or lead concentrate depending on mineralized material campaign.
- Zinc rougher flotation.
- Bulk concentrate regrind (copper or lead concentrate).
- Zinc concentrate regrind.
- Bulk cleaner flotation, using three stages of cleaning (copper or lead concentrate).
- Zinc cleaner flotation, using two stages of cleaning.
- Bulk concentrate thickening and filtration (copper or lead concentrate).
- Zinc concentrate thickening and filtration.
- Tailings thickening and disposal in the common TMF.
Metal Production
Metal production figures are summarized in Table 6.
TABLE 6 | ||||
Metal | Life of Project | Average Annual | ||
Gold (K oz) | 692 | 58 | ||
Zinc (M LBS) | 801 | 67 | ||
Copper (M lbs) | 86 | 7 | ||
Silver (K oz) | 6,260 | 522 | ||
Lead (M lbs) | 26 | 2 | ||
The production profile at Base Case metal prices is shown in Figure 1.
A summary of the life of project revenue by metal, revenue by product, and recovery by metal are included in Table 7 (calculated at Base Case metal prices).
TABLE 7 | |||||||||||
Revenue by Metal | Revenue by Product | Total Recovery by Metal | |||||||||
Metal | % of Revenue | Product | % of Revenue | Metal | Recovery | ||||||
Gold | 45% | Zinc Concentrate | 43% | Gold | 74.3% | ||||||
Zinc | 38% | Copper Concentrate | 38% | Zinc | 91.9% | ||||||
Copper | 11% | Doré | 13% | Copper | 81.2% | ||||||
Silver | 5% | Lead Concentrate | 6% | Silver | 67.2% | ||||||
Lead | 1% | Total | 100% | Lead | 83.7% | ||||||
Total | 100% | ||||||||||
Concentrate Marketing
In addition to a Doré, the Back Forty Project will produce zinc, copper and lead concentrates. The zinc concentrates will on average grade 53.9%, the copper concentrates will on average grade 18.5% (with high precious metals content), and the lead concentrate will on average grade 35%. Over its 12-year life, the Project will on average annually produce 66,200 tonnes of zinc concentrate, 18,600 tonnes of copper concentrate and 3,100 tonnes of lead concentrate. All concentrates are expected to be marketable. Studies are ongoing to evaluate the optimal blends, destinations and transport options for Back Forty concentrates. The Company believes that there are multiple attractive options for each of the concentrates.
CAPITAL AND OPERATING COSTS
The capital estimate is summarized in Table 8 by area and by discipline. All costs are based on Q3 2019 pricing. The estimate is deemed to have an accuracy of ±25%.
TABLE 8 CAPITAL ESTIMATE SUMMARY BY AREA | ||
Item | Capital Costs ($M) | |
Construction Indirects | 11.4 | |
Oxide Process Plant | 24.1 | |
Sulphide Process Plant | 57.5 | |
TMF/Waste Rock Facility | 42.6 | |
Infrastructure | 34.2 | |
Mining | 23.6 | |
EPCM | 15.7 | |
Owner costs | 11.4 | |
Subtotal | 220.6 | |
Contingency (14%) | 29.9 | |
Total | 250.4 | |
Sustaining Capital
Capital expenditures incurred after Year -1 are considered sustaining capital. Open pit sustaining capital totals $45.9M in expenditures primarily incurred between Year 1 and Year 6. Initial capital costs for the underground mine are treated as sustaining capital costs for the Back Forty Project since open pit mining will be well underway by the time the underground mine is developed. Sustaining capital costs also include all costs associated with infrastructure, capital waste development (vertical and lateral), relevant equipment leasing costs (down payments, legal fees, origination costs and mobilization costs), and the paste backfill plant. Total underground sustaining capital costs are estimated at $98.9M primarily incurred in Year 5 and Year 6.
Other Project sustaining capital costs include subsequent TMF stage raises over the LOM and process plant annual capital expenditures. Other Project sustaining capital schedule over the life of mine is estimated at $69.3M incurred between Year 1 and Year 5.
Mine closure costs, salvage value and rehabilitation costs are estimated at $75M.
Operating Costs
A summary of the life of project operating costs is outlined in Table 9.
TABLE 9 | ||||
Life of Project Cost | Unit Cost | |||
Gross Revenue | 2,095 | 132 | ||
Realization Charges | 310 | 19 | ||
NSR (Base Case) | 1,785 | 113 | ||
Open pit mining | 178 | 11 | ||
Underground mining | 288 | 18 | ||
Process plant | 310 | 20 | ||
G&A | 46 | 3 | ||
Total Site Opex | 821 | 52 | ||
Qualified Persons
This news release has been reviewed and approved by the Qualified Persons noted below. The Qualified Persons have reviewed or verified all information for which they are individually responsible.
TABLE 10 | ||||
Qualified Person | Employer | Professional | ||
Neil Lincoln | Lincoln Metallurgical Inc. | P.Eng. | ||
Andrew Bradfield | P&E Mining Consultants Inc. | P.Eng. | ||
Yungang Wu | P&E Mining Consultants Inc. | P.Geo. | ||
David Penswick | Gibsonian Inc | P.Eng. | ||
About Aquila
Aquila Resources Inc. (TSX: AQA, OTCQB: AQARF) is a development‐stage company focused on high grade and gold-rich projects in the Upper Midwest, USA.
Contacts
Barry Hildred, CEO
Aquila Resources Inc.
Tel: 647.943.5672
Email: [email protected]
David Carew, Director of Corporate Development & Investor Relations
Aquila Resources Inc.
Tel: 647.943.5677
Email: [email protected]