- Quarter End AUM of $31.2 billion
- Operating Margin of 32.4% for the First Quarter
- First Quarter Earnings of $0.81 per Share versus $0.64 per Share in the First Quarter of 2024
- $175.4 million in Cash, Cash Equivalents, Seed Capital, and Investments, and No Debt
- Entered Partnership with Keeley on May 1st of 4 Open-End Funds and ~500 Separately Managed Accounts from Keeley-Teton, Adding Close to $1.0 billion in AUM
- Opened an office in Zurich, Switzerland
GREENWICH, Conn., May 08, 2025 (GLOBE NEWSWIRE) — GAMCO Investors, Inc. (“Gabelliâ€) (OTCQX: GAMI) today reported its operating results for the quarter ended March 31, 2025.
Financial Highlights
| (In thousands, except percentages and per share data) | |||||||||||||
| Â | Â | Three Months Ended | Â | ||||||||||
| Â | Â | March 31, 2025 | Â | December 31, 2024 | Â | March 31, 2024 | Â | ||||||
| U.S. GAAP | Â | Â | Â | Â | Â | Â | Â | ||||||
| Revenue | Â | $ | 57,328 | Â | Â | $ | 59,262 | Â | Â | $ | 56,945 | Â | Â |
| Expenses | Â | Â | 38,735 | Â | Â | Â | 42,130 | Â | Â | Â | 41,597 | Â | Â |
| Operating income | Â | Â | 18,593 | Â | Â | Â | 17,132 | Â | Â | Â | 15,348 | Â | Â |
| Non-operating income | Â | Â | 1,220 | Â | Â | Â | 3,452 | Â | Â | Â | 4,372 | Â | Â |
| Net income | Â | Â | 18,271 | Â | Â | Â | 15,269 | Â | Â | Â | 15,810 | Â | Â |
| Diluted earnings per share | Â | $ | 0.81 | Â | Â | $ | 0.64 | Â | Â | $ | 0.64 | Â | Â |
| Operating margin | Â | Â | 32.4 | % | Â | Â | 28.9 | % | Â | Â | 27.0 | % | Â |
| Â | Â | Â | Â | Â | Â | Â | Â | ||||||
Giving Back to Society – $80 million since IPO
Since our initial public offering in February 1999, our firm’s combined charitable donations total approximately $80 million, including $48 million through the shareholder designated charitable contribution program. Based on the program created by Warren Buffett at Berkshire Hathaway, our corporate charitable giving is unique in that the recipients of Gabelli’s charitable contributions are chosen directly by our shareholders, rather than by our corporate officers. Since its inception in 2013, Gabelli shareholders have designated charitable gifts to approximately 350 charitable organizations.
On August 6, 2024, Gabelli’s board of directors authorized the creation of a private foundation, headquartered in Reno, Nevada, to continue our charitable giving program with an initial contribution of $5 million.
Revenue
| (In thousands) | Three Months Ended | Â | ||||||
| Â | March 31, 2025 | Â | March 31, 2024 | Â | ||||
| Investment advisory and incentive fees | Â | Â | Â | Â | ||||
| Funds | $ | 38,681 | Â | Â | $ | 37,270 | Â | Â |
| Institutional and Private Wealth Management | Â | 15,101 | Â | Â | Â | 15,196 | Â | Â |
| SICAV | Â | 4 | Â | Â | Â | 6 | Â | Â |
| Total | $ | 53,786 | Â | Â | $ | 52,472 | Â | Â |
| Distribution fees and other income | Â | 3,542 | Â | Â | Â | 4,473 | Â | Â |
| Total revenue | $ | 57,328 | Â | Â | $ | 56,945 | Â | Â |
| Â | Â | Â | Â | Â | ||||
The year over year increase in Funds revenues was primarily the result of higher average assets under management. The decrease in Institutional and Private Wealth Management revenues was primarily the result of lower beginning of the quarter equity assets under management, which are generally used to calculate the revenues. The decrease in distribution fees and other income was primarily the result of a decrease in equity mutual funds AUM that pay distribution fees.
Expenses
| (In thousands) | Three Months Ended | Â | ||||||
| Â | March 31, 2025 | Â | March 31, 2024 | Â | ||||
| Compensation | $ | 26,616 | Â | Â | $ | 28,554 | Â | Â |
| Management fee | Â | 2,202 | Â | Â | Â | 2,191 | Â | Â |
| Distribution costs | Â | 5,138 | Â | Â | Â | 5,950 | Â | Â |
| Other operating expenses | Â | 4,779 | Â | Â | Â | 4,902 | Â | Â |
| Total expenses | $ | 38,735 | Â | Â | $ | 41,597 | Â | Â |
| Â | Â | Â | Â | Â | ||||
- The lower compensation expense in the first quarter of 2025 when compared to the prior year quarter reflected $2.8 million of waived compensation partially offset by increased fixed compensation of $0.2 million and increased variable compensation of $0.6 million.
Operating Margin
The operating margin, which represents the ratio of operating income to revenue, was 32.4% for the first quarter of 2025 compared with 27.0% for the first quarter of 2024.
Non-Operating Income
| (In thousands) | Three Months Ended | Â | ||||||
| Â | March 31, 2025 | Â | March 31, 2024 | Â | ||||
| Gain/(loss) from investments, net | $ | (110 | ) | Â | $ | 1,632 | Â | Â |
| Interest and dividend income | Â | 1,622 | Â | Â | Â | 3,033 | Â | Â |
| Interest expense (a) | Â | (292 | ) | Â | Â | (293 | ) | Â |
| Total non-operating income | $ | 1,220 | Â | Â | $ | 4,372 | Â | Â |
| Â | Â | Â | Â | Â | ||||
| (a) Related to GAAP accounting of finance lease. | ||||||||
| Â | Â | Â | Â | Â | ||||
Non-operating income decreased $3.2 million for the quarter, reflecting the mark-to-market net loss on our investment portfolio for the quarter and a decrease in interest and dividend income.
Other Financial Highlights
The effective income tax rate (“ETRâ€) for the first quarter of 2025 was 7.8% versus 19.8% for the first quarter of 2024. The ETR for the first quarter of 2025 consisted of the statutory Federal tax rate of 21% offset by a net state income credit rate of 13.2%, relating to the release of an uncertain tax position accrual as a result of a settlement with New York State whereby the Company gave up the right to a refund in exchange for the closing of the audit years 2007-2014.
Cash, cash equivalents, and investments were $175.4 million with no debt at March 31, 2025.
Growth Initiatives: Lift-outs, Partnerships, Joint Ventures, New Markets
- Partnership with Keeley management will enhance our research and portfolio teams for small and mid-cap focused assets
On May 1, 2025, Gabelli completed partnership with the Keeley family for the management contracts of 4 open-end funds and approximately 500 separately managed accounts from Teton Advisors, LLC, adding close to $1.0 billion of AUM. The current Chicago-based Keeley research, portfolio management, and client service teammates have joined Gabelli and continue to manage and service these AUM. Our history with the Keeley founder, John L. Keeley, Jr., goes back to before the founding of our enterprise from the mid-1960s when John L. Keeley, Jr. and our Executive Chairman were both sell side analysts. Both firms are privileged to continue our shared focus on a client first culture.
- Opened Zurich office with lift-out of research and sales teammates.
Assets Under Management
| (In millions) | As of | Â | ||||||||||
| Â | March 31, 2025 | Â | December 31, 2024 | Â | March 31, 2024 | Â | ||||||
| Â | Â | Â | Â | Â | Â | Â | ||||||
| Mutual Funds | $ | 7,959 | Â | Â | $ | 8,078 | Â | Â | $ | 8,235 | Â | Â |
| Closed-end Funds | Â | 7,365 | Â | Â | Â | 7,344 | Â | Â | Â | 7,313 | Â | Â |
| Institutional & PWM (a) (b) | Â | 10,182 | Â | Â | Â | 10,700 | Â | Â | Â | 11,146 | Â | Â |
| SICAV | Â | 9 | Â | Â | Â | 9 | Â | Â | Â | 9 | Â | Â |
| Total Equities | Â | 25,515 | Â | Â | Â | 26,131 | Â | Â | Â | 26,703 | Â | Â |
| Â | Â | Â | Â | Â | Â | Â | ||||||
| 100% U.S. Treasury Money Market Fund | Â | 5,638 | Â | Â | Â | 5,552 | Â | Â | Â | 4,965 | Â | Â |
| Institutional & PWM Fixed Income | Â | 32 | Â | Â | Â | 32 | Â | Â | Â | 32 | Â | Â |
| Total Treasuries & Fixed Income | Â | 5,670 | Â | Â | Â | 5,584 | Â | Â | Â | 4,997 | Â | Â |
| Total Assets Under Management | $ | 31,185 | Â | Â | $ | 31,715 | Â | Â | $ | 31,700 | Â | Â |
| Â | Â | Â | Â | Â | Â | Â | ||||||
| (a) Includes $206, $242, and $345 of AUM subadvised for Teton Advisors, Inc. at March 31, 2025, | Â | |||||||||||
| December 31, 2024, and March 31, 2024, respectively. | Â | |||||||||||
| (b) Includes $233, $237, and $225 of 100% U.S. Treasury Money Market Fund AUM at March 31, 2025, | Â | |||||||||||
| December 31, 2024, and March 31, 2024, respectively. | Â | |||||||||||
| Â | Â | Â | Â | Â | Â | Â | ||||||
Assets under management on March 31, 2025 were $31.2 billion, a decrease of 1.6% from the $31.7 billion on December 31, 2024. The quarter’s decrease consisted of net outflows of $0.7 billion, and distributions, net of reinvestments, of $0.1 billion partially offset by net market appreciation of $0.3 billion.
Mutual Funds
Assets under management in Mutual Funds on March 31, 2025 were $8.0 billion, a decrease of 1.2% from the $8.1 billion at December 31, 2024. The quarterly change was attributed to:
- Distributions, net of reinvestment, of $4 million;
- Net outflows of $199 million; and
- Net market appreciation of $84 million.
Closed-end Funds
Assets under management in Closed-end Funds on March 31, 2025 were $7.4 billion, an increase of 1.4% from the $7.3 billion on December 31, 2024. The quarterly change was comprised of:
- Distributions, net of reinvestment, of $138 million;
- Net outflows of $40 million, including the redemption of $37 million of preferred shares, and the repurchase of $11 million of common stock partially offset by the issuance of $8 million preferred shares; and
- Net market appreciation of $199 million.
Institutional & PWM
Assets under management in Institutional & PWM on March 31, 2025 were $10.2 billion, a decrease of 4.7% from the $10.7 billion on December 31, 2024. The quarterly change was due to:
- Net outflows of $481 million; and
- Net market depreciation of $37 million.
SICAV
Assets under management were $9 million in the GAMCO All Cap Value sleeve and the GAMCO Convertible Securities sleeve on March 31, 2025, unchanged from $9 million at December 31, 2024.
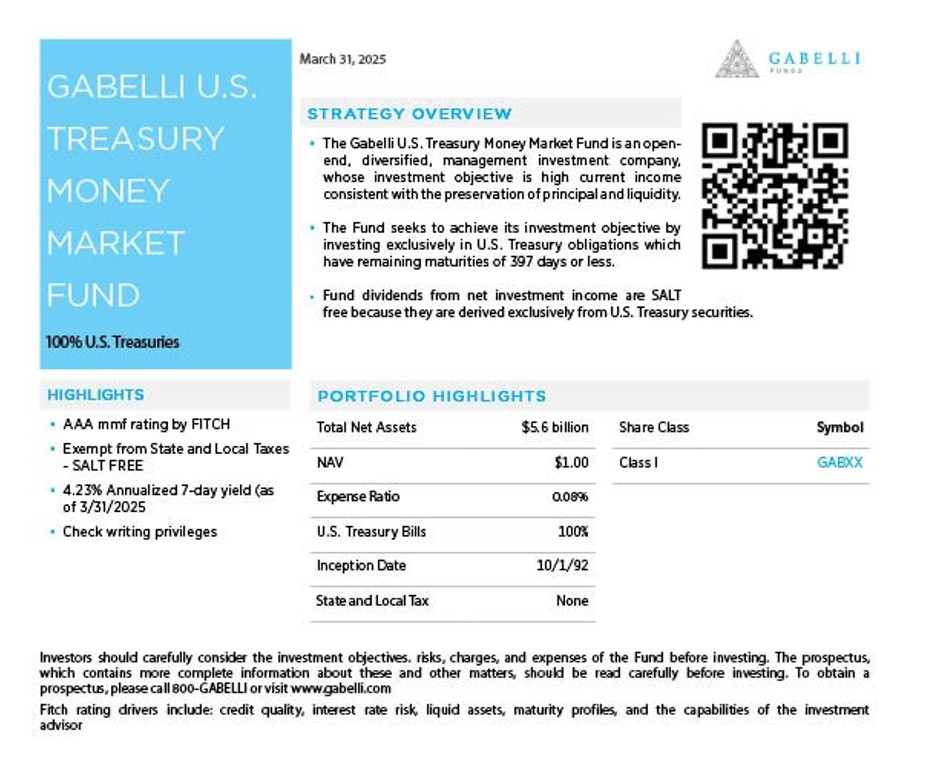
100% U.S. Treasury Money Market Fund
Assets under management in our 100% U.S. Treasury Money Market Fund (GABXX) on March 31, 2025 were $5.6 billion unchanged from the $5.6 billion at December 31, 2024.
The Gabelli Gold Fund – Up 32% For 1st quarter of 2025
Portfolio manager Caesar Bryan commented on The Gabelli Gold Fund’s 1st quarter 2025 performance:
The gold price performed strongly in the first quarter of 2025, building on its gains over the past two years. Gold ended the quarter at $3,124 per ounce for a gain of about $500 per ounce or 19.0%. Gold mining equities returned in excess of 30%, outperforming the gold price by over fifty percent. Until recently, the gold price has appreciated largely due to overseas central bank buying. However, more recently, investors have been adding to their gold holdings. This is evidenced by the rise in ounces of gold held by all the gold bullion ETFs. During the first quarter, gold ETFs added over 5m ounces to 88.0m ounces, which amounts to about $15bn. Unsurprisingly, in a strong quarter for gold stocks, our larger holdings were the top contributors to performance. The biggest contributor was Agnico Eagle, our largest holding, which appreciated by 39.1% and added 3.5% to performance. Other leading contributors were Newmont, Kinross, and Alamos. In terms of stock price performance, some of our smaller producers and development companies dominated. In this environment, gold should perform well and gold equities, that are over twenty five percent lower than their 2011 high, offer an opportunity for significant capital gains and income.
Assets Under Administration
| (In millions) | As of | Â | ||||||||||
| Â | March 31, 2025 | Â | December 31, 2024 | Â | March 31, 2024 | Â | ||||||
| Â | Â | Â | Â | Â | Â | Â | ||||||
| Teton-Keeley Funds (a) | $ | 750 | Â | Â | $ | 809 | Â | Â | $ | 952 | Â | Â |
| SICAV | Â | 401 | Â | Â | Â | 408 | Â | Â | Â | 580 | Â | Â |
| Total Assets Under Administration | $ | 1,151 | Â | Â | $ | 1,217 | Â | Â | $ | 1,532 | Â | Â |
| Â | Â | Â | Â | Â | Â | Â | ||||||
| (a) Includes $206, $242 and $345 of AUM subadvised for Teton Advisors, Inc. at | Â | |||||||||||
| March 31, 2025, December 31, 2024 and March 31, 2024, respectively. | Â | |||||||||||
| Â | Â | Â | Â | Â | Â | Â | ||||||
AUA on March 31, 2025 were $1.2 billion, unchanged from the $1.2 billion at December 31, 2024.
Return to Shareholders
During the first quarter of 2025, Gabelli returned $14.1 million to shareholders in the form of the repurchase of 499,710 shares for $12.3 million at an average investment of $24.27 per share and a regular quarterly dividend of $0.08 per share totaling $1.8 million. From April 1, 2025 to May 7, 2025, the Company has repurchased 19,213 shares at an average price of $20.90 per share for an aggregate purchase price of approximately $0.4 million.
On May 7, 2025, Gabelli’s board of directors declared a regular quarterly dividend of $0.08 per share, which is payable on June 24, 2025 to class A and class B shareholders of record on June 10, 2025.
Balance Sheet Information       Â
As of March 31, 2025, cash, cash equivalents, and U.S Treasury Bills were $103.5 million and investments were $71.9 million, compared with cash, cash equivalents, and U.S. Treasury Bills of $116.5 million and investments of $66.3 million as of December 31, 2024. As of March 31, 2025, stockholders’ equity was $141.6 million compared to $137.3 million as of December 31, 2024. The increase in stockholders’ equity resulted from $18.3 million in net income offset partially by the payment of $1.8 million in dividends and $12.3 million of stock buybacks.
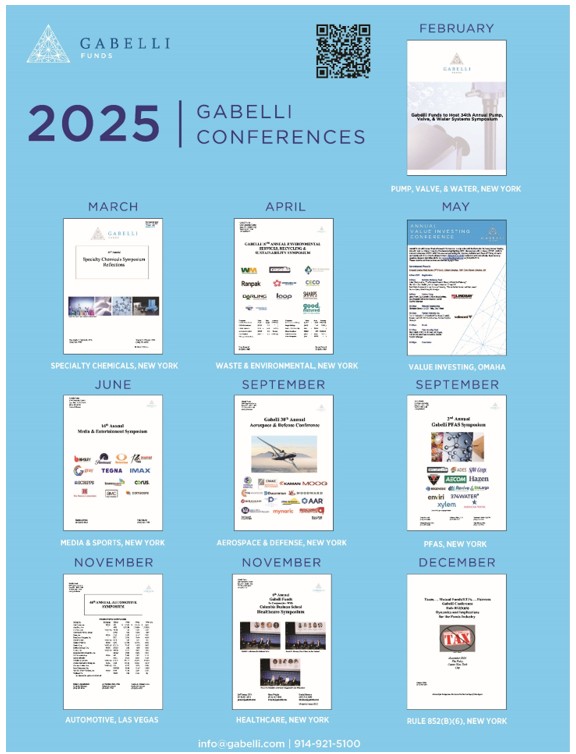
Symposiums/Conferences
- On February 27th, we hosted our 35th Annual Pump, Valve & Water Systems Symposium. The symposium focused on themes crucial to this industry, including infrastructure spending, resource security, conservation, and M&A.
- On March 20th, we hosted our 16th Annual Specialty Chemicals Symposium. The symposium featured presentations from senior management of leading specialty chemicals companies, with a focus on pricing power, margin recovery, interest rates, destocking, global supply chain, global demand trends, and the M&A environment.
- On May 2nd, GAMCO hosted its 19th annual Omaha Research Trip in conjunction with the Berkshire Hathaway Annual Meeting. This Value Investor Conference attracted a record number of participants with Gabelli portfolio managers anchoring panels with noted Berkshire experts and regional CEOs.
We are hosting the following symposiums and conferences in 2025:
About Gabelli
Gabelli (OTCQX: GAMI), established in 1977 and incorporated under the laws of Delaware, is a widely-recognized provider of investment advisory services to 24 open-end funds, 13 United States closed-end funds and one United Kingdom limited investment company, 5 actively managed exchange traded funds, one société d’investissement à capital variable, and approximately 1,400 institutional and private wealth management investors principally in the U.S. The Company’s revenues are based primarily on the levels of assets under management and fees associated with the various investment products.
In 1977, Gabelli launched its well-known All Cap Value equity strategy, Gabelli Value, in a separate account format and in 1986 entered the mutual fund business. Today, Gabelli offers a diverse set of client solutions across asset classes (e.g. Equities, Debt Instruments, Convertibles, non-market correlated Merger Arbitrage), regions, market capitalizations, sectors (e.g. Gold, Utilities) and investment styles (e.g. Value, Growth). Gabelli serves a broad client base, including institutions, intermediaries, offshore investors, private wealth, and direct retail investors.
CAUTIONARY STATEMENT REGARDING FORWARD-LOOKING STATEMENTS
Our disclosure and analysis in this press release, which do not present historical information, contain “forward-looking statements†within the meaning of the U.S. Private Securities Litigation Reform Act of 1995. Forward-looking statements convey our current expectations or forecasts of future events. You can identify these statements because they do not relate strictly to historical or current facts. They use words such as “anticipate,†“estimate,†“expect,†“project,†“intend,†“plan,†“believe,†and other words and terms of similar meaning. They also appear in any discussion of future operating or financial performance. In particular, these include statements relating to future actions, future performance of our products, expenses, the outcome of any legal proceedings, and financial results. Although we believe that we are basing our expectations and beliefs on reasonable assumptions within the bounds of what we currently know about our business and operations, the economy, and other conditions, there can be no assurance that our actual results will not differ materially from what we expect or believe. Therefore, you should proceed with caution in relying on any of these forward-looking statements. They are neither statements of historical fact nor guarantees or assurances of future performance.
Forward-looking statements involve a number of known and unknown risks, uncertainties and other important factors, some of which are listed below, that are difficult to predict and could cause actual results and outcomes to differ materially from any future results or outcomes expressed or implied by such forward-looking statements. Some of the factors that may cause our actual results to differ from our expectations include risks associated with the duration and scope of the ongoing coronavirus pandemic resulting in volatile market conditions, a decline in the securities markets that adversely affect our assets under management, negative performance of our products, the failure to perform as required under our investment management agreements, and a general downturn in the economy that negatively impacts our operations. We also direct your attention to the more specific discussions of these and other risks, uncertainties and other important factors contained in our Annual Report and other public filings. Other factors that could cause our actual results to differ may emerge from time to time, and it is not possible for us to predict all of them. We do not undertake to update publicly any forward-looking statements if we subsequently learn that we are unlikely to achieve our expectations whether as a result of new information, future developments or otherwise, except as may be required by law.
Gabelli Funds, LLC is a registered investment adviser with the Securities and Exchange Commission and is a wholly owned subsidiary of GAMCO Investors, Inc. (OTCQX: GAMI).
Investors should carefully consider the investment objectives, risks, charges and expenses of the fund before investing. The prospectus, which contains more complete information about this and other matters, should be read carefully before investing. To obtain a prospectus, please call 800 GABELLI or visit www.gabelli.com
Fitch rating drivers include: credit quality, interest rate risk, liquid assets, maturity profiles, and the capabilities of the investment advisor
Money Market Fund
Investment in the fund is neither guaranteed nor insured by the Federal Deposit Insurance Corporation or any government agency. Although the fund seeks to preserve the value of your investment at $1.00 per share, it cannot guarantee it will do so. The fund’s sponsor has no legal obligation to provide financial support to the fund, and you should not expect that the sponsor will provide financial support to the fund at any time. You could lose money by investing in the fund.
Gold
Investments related to gold and other precious metals and minerals are considered speculative and are affected by a variety of worldwide economic, financial, and political factors. Investing in foreign securities involves risks not ordinarily associated with investment in domestic issues. Funds concentrating in specific sectors may experience greater fluctuations in value than funds that are more diversified. Not FDIC Insured. Not Bank Guaranteed. May Lose Value.
As of March 31, 2025, GAMI and affiliates owned less than one percent of all stocks mentioned in the Gold Fund.
Returns represent past performance and do not guarantee future results. Investment returns and the principal value of an investment will fluctuate. When shares are redeemed, they may be worth more or less than their original cost. Current performance may be lower or higher than the performance data presented. Visit www.gabelli.com for performance information as of the most recent month end.
| GAMCO Investors, Inc. and Subsidiaries | Â | |||||||||||
| Condensed Consolidated Statements of Operations (Unaudited) | Â | |||||||||||
| (in thousands, except per share data) | Â | |||||||||||
| Â | Three Months Ended | Â | ||||||||||
| Â | March 31, 2025 | Â | December 31, 2024 | Â | March 31, 2024 | Â | ||||||
| Revenue: | Â | Â | Â | Â | Â | Â | ||||||
| Investment advisory and incentive fees | $ | 53,786 | Â | Â | $ | 55,502 | Â | Â | $ | 52,472 | Â | Â |
| Distribution fees and other income | Â | 3,542 | Â | Â | Â | 3,760 | Â | Â | Â | 4,473 | Â | Â |
| Total revenue | Â | 57,328 | Â | Â | Â | 59,262 | Â | Â | Â | 56,945 | Â | Â |
| Expenses: | Â | Â | Â | Â | Â | Â | ||||||
| Compensation | Â | 26,616 | Â | Â | Â | 28,839 | Â | Â | Â | 28,554 | Â | Â |
| Management fee | Â | 2,202 | Â | Â | Â | 2,287 | Â | Â | Â | 2,191 | Â | Â |
| Distribution costs | Â | 5,138 | Â | Â | Â | 5,634 | Â | Â | Â | 5,950 | Â | Â |
| Other operating expenses | Â | 4,779 | Â | Â | Â | 5,370 | Â | Â | Â | 4,902 | Â | Â |
| Total expenses | Â | 38,735 | Â | Â | Â | 42,130 | Â | Â | Â | 41,597 | Â | Â |
| Operating income | Â | 18,593 | Â | Â | Â | 17,132 | Â | Â | Â | 15,348 | Â | Â |
| Non-operating income: | Â | Â | Â | Â | Â | Â | ||||||
| Gain/(loss) from investments, net | Â | (110 | ) | Â | Â | 644 | Â | Â | Â | 1,632 | Â | Â |
| Interest and dividend income | Â | 1,622 | Â | Â | Â | 3,090 | Â | Â | Â | 3,033 | Â | Â |
| Interest expense | Â | (292 | ) | Â | Â | (282 | ) | Â | Â | (293 | ) | Â |
| Total non-operating income | Â | 1,220 | Â | Â | Â | 3,452 | Â | Â | Â | 4,372 | Â | Â |
| Income before provision for income taxes | Â | 19,813 | Â | Â | Â | 20,584 | Â | Â | Â | 19,720 | Â | Â |
| Provision for income taxes | Â | 1,542 | Â | Â | Â | 5,315 | Â | Â | Â | 3,910 | Â | Â |
| Net income | $ | 18,271 | Â | Â | $ | 15,269 | Â | Â | $ | 15,810 | Â | Â |
| Â | Â | Â | Â | Â | Â | Â | ||||||
| Earnings per share attributable to common | Â | Â | Â | Â | Â | Â | ||||||
| stockholders: | Â | Â | Â | Â | Â | Â | ||||||
| Basic | $ | 0.81 | Â | Â | $ | 0.64 | Â | Â | $ | 0.64 | Â | Â |
| Diluted | $ | 0.81 | Â | Â | $ | 0.64 | Â | Â | $ | 0.64 | Â | Â |
| Â | Â | Â | Â | Â | Â | Â | ||||||
| Weighted average shares outstanding: | Â | Â | Â | Â | Â | Â | ||||||
| Basic | Â | 22,632 | Â | Â | Â | 23,971 | Â | Â | Â | 24,808 | Â | Â |
| Diluted | Â | 22,632 | Â | Â | Â | 23,971 | Â | Â | Â | 24,808 | Â | Â |
| Â | Â | Â | Â | Â | Â | Â | ||||||
| Shares outstanding | Â | 22,431 | Â | Â | Â | 22,930 | Â | Â | Â | 24,585 | Â | Â |
| Â | Â | Â | Â | Â | Â | Â | ||||||
| GAMCO Investors, Inc. and Subsidiaries | Â | |||||||||||
| Condensed Consolidated Statements of Financial Condition (Unaudited) | Â | |||||||||||
| (in thousands) | Â | |||||||||||
| Â | Â | Â | ||||||||||
| Â | March 31, | Â | December 31, | Â | March 31, | Â | ||||||
| Â | Â | 2025 | Â | Â | Â | 2024 | Â | Â | Â | 2024 | Â | Â |
| Assets | Â | Â | Â | Â | Â | Â | ||||||
| Cash and cash equivalents | $ | 53,596 | Â | Â | $ | 17,254 | Â | Â | $ | 65,467 | Â | Â |
| Short-term investments in U.S. Treasury Bills | Â | 49,900 | Â | Â | Â | 99,216 | Â | Â | Â | 99,073 | Â | Â |
| Investments in securities | Â | 43,117 | Â | Â | Â | 36,855 | Â | Â | Â | 30,351 | Â | Â |
| Seed capital investments | Â | 28,772 | Â | Â | Â | 29,452 | Â | Â | Â | 26,184 | Â | Â |
| Receivable from brokers | Â | 3,030 | Â | Â | Â | 3,103 | Â | Â | Â | 1,111 | Â | Â |
| Other receivables | Â | 20,062 | Â | Â | Â | 21,246 | Â | Â | Â | 23,576 | Â | Â |
| Deferred tax asset and income tax receivable | Â | 9,420 | Â | Â | Â | 8,042 | Â | Â | Â | 8,384 | Â | Â |
| Other assets | Â | 10,207 | Â | Â | Â | 9,509 | Â | Â | Â | 9,614 | Â | Â |
| Total assets | $ | 218,104 | Â | Â | $ | 224,677 | Â | Â | $ | 263,760 | Â | Â |
| Â | Â | Â | Â | Â | Â | Â | ||||||
| Liabilities and stockholders’ equity | Â | Â | Â | Â | Â | Â | ||||||
| Income taxes payable | $ | 9,902 | Â | Â | $ | 193 | Â | Â | $ | 3,464 | Â | Â |
| Compensation payable | Â | 26,915 | Â | Â | Â | 40,633 | Â | Â | Â | 25,100 | Â | Â |
| Accrued expenses and other liabilities | Â | 39,713 | Â | Â | Â | 46,546 | Â | Â | Â | 45,910 | Â | Â |
| Total liabilities | Â | 76,530 | Â | Â | Â | 87,372 | Â | Â | Â | 74,474 | Â | Â |
| Â | Â | Â | Â | Â | Â | Â | ||||||
| Stockholders’ equity | Â | 141,574 | Â | Â | Â | 137,305 | Â | Â | Â | 189,286 | Â | Â |
| Total liabilities and stockholders’ equity | $ | 218,104 | Â | Â | $ | 224,677 | Â | Â | $ | 263,760 | Â | Â |
| Â | Â | Â | Â | Â | Â | Â | ||||||
| Â | Â | Â | Â | Â | Â | Â | ||||||
| GAMCO Investors, Inc. and Subsidiaries |  | |||||||||||||||||
| Assets Under Management | Â | |||||||||||||||||
| By investment vehicle | Â | |||||||||||||||||
| (in millions) | Â | |||||||||||||||||
| Â | Three Months Ended | Â | % Changed From | Â | ||||||||||||||
| Â | March 31, | Â | December 31, | Â | March 31, | Â | December 31, | Â | March 31, | Â | ||||||||
| Â | Â2025 | Â | Â2024 | Â | Â2024 | Â | 2024 | Â | 2024 | Â | ||||||||
| Equities: | Â | Â | Â | Â | Â | Â | Â | Â | Â | Â | ||||||||
| Mutual Funds | Â | Â | Â | Â | Â | Â | Â | Â | Â | Â | ||||||||
| Beginning of period assets | $ | 8,078 | Â | Â | $ | 8,440 | Â | Â | $ | 7,973 | Â | Â | Â | Â | Â | Â | ||
| Inflows | Â | 190 | Â | Â | Â | 211 | Â | Â | Â | 176 | Â | Â | Â | Â | Â | Â | ||
| Outflows | Â | (389 | ) | Â | Â | (420 | ) | Â | Â | (432 | ) | Â | Â | Â | Â | Â | ||
| Net inflows (outflows) | Â | (199 | ) | Â | Â | (209 | ) | Â | Â | (256 | ) | Â | Â | Â | Â | Â | ||
| Market appreciation (depreciation) | Â | 84 | Â | Â | Â | (126 | ) | Â | Â | 523 | Â | Â | Â | Â | Â | Â | ||
| Fund distributions, net of reinvestment | Â | (4 | ) | Â | Â | (27 | ) | Â | Â | (5 | ) | Â | Â | Â | Â | Â | ||
| Total increase (decrease) | Â | (119 | ) | Â | Â | (362 | ) | Â | Â | 262 | Â | Â | Â | Â | Â | Â | ||
| Assets under management, end of period | $ | 7,959 | Â | Â | $ | 8,078 | Â | Â | $ | 8,235 | Â | Â | -1.5 | % | Â | -3.4 | % | Â |
| Percentage of total assets under management | Â | 25.5 | % | Â | Â | 25.5 | % | Â | Â | 26.0 | % | Â | Â | Â | Â | Â | ||
| Average assets under management | $ | 8,176 | Â | Â | $ | 8,447 | Â | Â | $ | 7,965 | Â | Â | -3.2 | % | Â | 2.6 | % | Â |
| Â | Â | Â | Â | Â | Â | Â | Â | Â | Â | Â | ||||||||
| Closed-end Funds | Â | Â | Â | Â | Â | Â | Â | Â | Â | Â | ||||||||
| Beginning of period assets | $ | 7,344 | Â | Â | $ | 7,459 | Â | Â | $ | 7,097 | Â | Â | Â | Â | Â | Â | ||
| Inflows | Â | 8 | Â | Â | Â | 212 | Â | Â | Â | 41 | Â | Â | Â | Â | Â | Â | ||
| Outflows | Â | (48 | ) | Â | Â | (43 | ) | Â | Â | (103 | ) | Â | Â | Â | Â | Â | ||
| Net inflows (outflows) | Â | (40 | ) | Â | Â | 169 | Â | Â | Â | (62 | ) | Â | Â | Â | Â | Â | ||
| Market appreciation (depreciation) | Â | 199 | Â | Â | Â | (155 | ) | Â | Â | 404 | Â | Â | Â | Â | Â | Â | ||
| Fund distributions, net of reinvestment | Â | (138 | ) | Â | Â | (129 | ) | Â | Â | (126 | ) | Â | Â | Â | Â | Â | ||
| Total increase (decrease) | Â | 21 | Â | Â | Â | (115 | ) | Â | Â | 216 | Â | Â | Â | Â | Â | Â | ||
| Assets under management, end of period | Â | 7,365 | Â | Â | $ | 7,344 | Â | Â | $ | 7,313 | Â | Â | 0.3 | % | Â | 0.7 | % | Â |
| Percentage of total assets under management | Â | 23.6 | % | Â | Â | 23.2 | % | Â | Â | 23.1 | % | Â | Â | Â | Â | Â | ||
| Average assets under management | $ | 7,505 | Â | Â | $ | 7,610 | Â | Â | $ | 7,060 | Â | Â | -1.4 | % | Â | 6.3 | % | Â |
| Â | Â | Â | Â | Â | Â | Â | Â | Â | Â | Â | ||||||||
| Institutional & PWM | Â | Â | Â | Â | Â | Â | Â | Â | Â | Â | ||||||||
| Beginning of period assets | $ | 10,700 | Â | Â | $ | 10,984 | Â | Â | $ | 10,738 | Â | Â | Â | Â | Â | Â | ||
| Inflows | Â | 120 | Â | Â | Â | 62 | Â | Â | Â | 66 | Â | Â | Â | Â | Â | Â | ||
| Outflows | Â | (601 | ) | Â | Â | (407 | ) | Â | Â | (428 | ) | Â | Â | Â | Â | Â | ||
| Net inflows (outflows) | Â | (481 | ) | Â | Â | (345 | ) | Â | Â | (362 | ) | Â | Â | Â | Â | Â | ||
| Market appreciation (depreciation) | Â | (37 | ) | Â | Â | 61 | Â | Â | Â | 770 | Â | Â | Â | Â | Â | Â | ||
| Total increase (decrease) | Â | (518 | ) | Â | Â | (284 | ) | Â | Â | 408 | Â | Â | Â | Â | Â | Â | ||
| Assets under management, end of period | $ | 10,182 | Â | Â | $ | 10,700 | Â | Â | $ | 11,146 | Â | Â | -4.8 | % | Â | -8.6 | % | Â |
| Percentage of total assets under management | Â | 32.7 | % | Â | Â | 33.7 | % | Â | Â | 35.2 | % | Â | Â | Â | Â | Â | ||
| Average assets under management | $ | 10,772 | Â | Â | $ | 11,085 | Â | Â | $ | 10,798 | Â | Â | -2.8 | % | Â | -0.2 | % | Â |
| Â | Â | Â | Â | Â | Â | Â | Â | Â | Â | Â | ||||||||
| SICAV | Â | Â | Â | Â | Â | Â | Â | Â | Â | Â | ||||||||
| Beginning of period assets | $ | 9 | Â | Â | $ | 9 | Â | Â | $ | 631 | Â | Â | Â | Â | Â | Â | ||
| Inflows | Â | – | Â | Â | Â | – | Â | Â | Â | – | Â | Â | Â | Â | Â | Â | ||
| Outflows | Â | – | Â | Â | Â | – | Â | Â | Â | (2 | ) | Â | Â | Â | Â | Â | ||
| Net inflows (outflows) | Â | – | Â | Â | Â | – | Â | Â | Â | (2 | ) | Â | Â | Â | Â | Â | ||
| Market appreciation (depreciation) | Â | – | Â | Â | Â | – | Â | Â | Â | – | Â | Â | Â | Â | Â | Â | ||
| Reclassification to AUA | Â | – | Â | Â | Â | – | Â | Â | Â | (620 | ) | Â | Â | Â | Â | Â | ||
| Total increase (decrease) | Â | – | Â | Â | Â | – | Â | Â | Â | (622 | ) | Â | Â | Â | Â | Â | ||
| Assets under management, end of period | $ | 9 | Â | Â | $ | 9 | Â | Â | $ | 9 | Â | Â | 0.0 | % | Â | 0.0 | % | Â |
| Percentage of total assets under management | Â | 0.0 | % | Â | Â | 0.0 | % | Â | Â | 0.0 | % | Â | Â | Â | Â | Â | ||
| Average assets under management | $ | 9 | Â | Â | $ | 9 | Â | Â | $ | 10 | Â | Â | 0.0 | % | Â | -10.0 | % | Â |
| Â | Â | Â | Â | Â | Â | Â | Â | Â | Â | Â | ||||||||
| Total Equities | Â | Â | Â | Â | Â | Â | Â | Â | Â | Â | ||||||||
| Beginning of period assets | $ | 26,131 | Â | Â | $ | 26,892 | Â | Â | $ | 26,439 | Â | Â | Â | Â | Â | Â | ||
| Inflows | Â | 318 | Â | Â | Â | 485 | Â | Â | Â | 283 | Â | Â | Â | Â | Â | Â | ||
| Outflows | Â | (1,038 | ) | Â | Â | (870 | ) | Â | Â | (965 | ) | Â | Â | Â | Â | Â | ||
| Net inflows (outflows) | Â | (720 | ) | Â | Â | (385 | ) | Â | Â | (682 | ) | Â | Â | Â | Â | Â | ||
| Market appreciation (depreciation) | Â | 246 | Â | Â | Â | (220 | ) | Â | Â | 1,697 | Â | Â | Â | Â | Â | Â | ||
| Fund distributions, net of reinvestment | Â | (142 | ) | Â | Â | (156 | ) | Â | Â | (131 | ) | Â | Â | Â | Â | Â | ||
| Reclassification to AUA | Â | – | Â | Â | Â | – | Â | Â | Â | (620 | ) | Â | Â | Â | Â | Â | ||
| Total increase (decrease) | Â | (616 | ) | Â | Â | (761 | ) | Â | Â | 264 | Â | Â | Â | Â | Â | Â | ||
| Assets under management, end of period | $ | 25,515 | Â | Â | $ | 26,131 | Â | Â | $ | 26,703 | Â | Â | -2.4 | % | Â | -4.4 | % | Â |
| Percentage of total assets under management | Â | 81.8 | % | Â | Â | 82.4 | % | Â | Â | 84.2 | % | Â | Â | Â | Â | Â | ||
| Average assets under management | $ | 26,462 | Â | Â | $ | 27,151 | Â | Â | $ | 25,833 | Â | Â | -2.5 | % | Â | 2.4 | % | Â |
| Â | Â | Â | Â | Â | Â | Â | Â | Â | Â | Â | ||||||||
| GAMCO Investors, Inc. and Subsidiaries |  | |||||||||||||||||
| Assets Under Management | Â | |||||||||||||||||
| By investment vehicle – continued |  | |||||||||||||||||
| (in millions) | Â | |||||||||||||||||
| Â | Three Months Ended | Â | % Changed From | Â | ||||||||||||||
| Â | March 31, | Â | December 31, | Â | March 31, | Â | December 31, | Â | March 31, | Â | ||||||||
| Â | Â2025 | Â | Â2024 | Â | Â2024 | Â | 2024 | Â | 2024 | Â | ||||||||
| Fixed Income: | Â | Â | Â | Â | Â | Â | Â | Â | Â | Â | ||||||||
| 100% U.S. Treasury fund | Â | Â | Â | Â | Â | Â | Â | Â | Â | Â | ||||||||
| Beginning of period assets | $ | 5,552 | Â | Â | $ | 5,268 | Â | Â | $ | 4,615 | Â | Â | Â | Â | Â | Â | ||
| Inflows | Â | 1,372 | Â | Â | Â | 1,656 | Â | Â | Â | 1,605 | Â | Â | Â | Â | Â | Â | ||
| Outflows | Â | (1,341 | ) | Â | Â | (1,440 | ) | Â | Â | (1,315 | ) | Â | Â | Â | Â | Â | ||
| Net inflows (outflows) | Â | 31 | Â | Â | Â | 216 | Â | Â | Â | 290 | Â | Â | Â | Â | Â | Â | ||
| Market appreciation (depreciation) | Â | 55 | Â | Â | Â | 68 | Â | Â | Â | 60 | Â | Â | Â | Â | Â | Â | ||
| Total increase (decrease) | Â | 86 | Â | Â | Â | 284 | Â | Â | Â | 350 | Â | Â | Â | Â | Â | Â | ||
| Assets under management, end of period | $ | 5,638 | Â | Â | $ | 5,552 | Â | Â | $ | 4,965 | Â | Â | 1.5 | % | Â | 13.6 | % | Â |
| Percentage of total assets under management | Â | 18.1 | % | Â | Â | 17.5 | % | Â | Â | 15.7 | % | Â | Â | Â | Â | Â | ||
| Average assets under management | $ | 5,552 | Â | Â | $ | 5,415 | Â | Â | $ | 4,832 | Â | Â | 2.5 | % | Â | 14.9 | % | Â |
| Â | Â | Â | Â | Â | Â | Â | Â | Â | Â | Â | ||||||||
| Institutional & PWM Fixed Income | Â | Â | Â | Â | Â | Â | Â | Â | Â | Â | ||||||||
| Beginning of period assets | $ | 32 | Â | Â | $ | 32 | Â | Â | $ | 32 | Â | Â | Â | Â | Â | Â | ||
| Inflows | Â | – | Â | Â | Â | – | Â | Â | Â | – | Â | Â | Â | Â | Â | Â | ||
| Outflows | Â | – | Â | Â | Â | – | Â | Â | Â | – | Â | Â | Â | Â | Â | Â | ||
| Net inflows (outflows) | Â | – | Â | Â | Â | – | Â | Â | Â | – | Â | Â | Â | Â | Â | Â | ||
| Market appreciation (depreciation) | Â | – | Â | Â | Â | – | Â | Â | Â | – | Â | Â | Â | Â | Â | Â | ||
| Total increase (decrease) | Â | – | Â | Â | Â | – | Â | Â | Â | – | Â | Â | Â | Â | Â | Â | ||
| Assets under management, end of period | $ | 32 | Â | Â | $ | 32 | Â | Â | $ | 32 | Â | Â | 0.0 | % | Â | 0.0 | % | Â |
| Percentage of total assets under management | Â | 0.1 | % | Â | Â | 0.1 | % | Â | Â | 0.1 | % | Â | Â | Â | Â | Â | ||
| Average assets under management | $ | 32 | Â | Â | $ | 32 | Â | Â | $ | 32 | Â | Â | 0.0 | % | Â | 0.0 | % | Â |
| Â | Â | Â | Â | Â | Â | Â | Â | Â | Â | Â | ||||||||
| Total Treasuries & Fixed Income | Â | Â | Â | Â | Â | Â | Â | Â | Â | Â | ||||||||
| Beginning of period assets | $ | 5,584 | Â | Â | $ | 5,300 | Â | Â | $ | 4,647 | Â | Â | Â | Â | Â | Â | ||
| Inflows | Â | 1,372 | Â | Â | Â | 1,656 | Â | Â | Â | 1,605 | Â | Â | Â | Â | Â | Â | ||
| Outflows | Â | (1,341 | ) | Â | Â | (1,440 | ) | Â | Â | (1,315 | ) | Â | Â | Â | Â | Â | ||
| Net inflows (outflows) | Â | 31 | Â | Â | Â | 216 | Â | Â | Â | 290 | Â | Â | Â | Â | Â | Â | ||
| Market appreciation (depreciation) | Â | 55 | Â | Â | Â | 68 | Â | Â | Â | 60 | Â | Â | Â | Â | Â | Â | ||
| Total increase (decrease) | Â | 86 | Â | Â | Â | 284 | Â | Â | Â | 350 | Â | Â | Â | Â | Â | Â | ||
| Assets under management, end of period | $ | 5,670 | Â | Â | $ | 5,584 | Â | Â | $ | 4,997 | Â | Â | 1.5 | % | Â | 13.5 | % | Â |
| Percentage of total assets under management | Â | 18.2 | % | Â | Â | 17.6 | % | Â | Â | 15.8 | % | Â | Â | Â | Â | Â | ||
| Average assets under management | $ | 5,584 | Â | Â | $ | 5,447 | Â | Â | $ | 4,864 | Â | Â | 2.5 | % | Â | 14.8 | % | Â |
| Â | Â | Â | Â | Â | Â | Â | Â | Â | Â | Â | ||||||||
| Total AUM | Â | Â | Â | Â | Â | Â | Â | Â | Â | Â | ||||||||
| Beginning of period assets | $ | 31,715 | Â | Â | $ | 32,192 | Â | Â | $ | 31,086 | Â | Â | Â | Â | Â | Â | ||
| Inflows | Â | 1,690 | Â | Â | Â | 2,141 | Â | Â | Â | 1,888 | Â | Â | Â | Â | Â | Â | ||
| Outflows | Â | (2,379 | ) | Â | Â | (2,310 | ) | Â | Â | (2,280 | ) | Â | Â | Â | Â | Â | ||
| Net inflows (outflows) | Â | (689 | ) | Â | Â | (169 | ) | Â | Â | (392 | ) | Â | Â | Â | Â | Â | ||
| Market appreciation (depreciation) | Â | 301 | Â | Â | Â | (152 | ) | Â | Â | 1,757 | Â | Â | Â | Â | Â | Â | ||
| Fund distributions, net of reinvestment | Â | (142 | ) | Â | Â | (156 | ) | Â | Â | (131 | ) | Â | Â | Â | Â | Â | ||
| Reclassification to AUA | Â | – | Â | Â | Â | – | Â | Â | Â | (620 | ) | Â | Â | Â | Â | Â | ||
| Total increase (decrease) | Â | (530 | ) | Â | Â | (477 | ) | Â | Â | 614 | Â | Â | Â | Â | Â | Â | ||
| Assets under management, end of period | $ | 31,185 | Â | Â | $ | 31,715 | Â | Â | $ | 31,700 | Â | Â | -1.7 | % | Â | -1.6 | % | Â |
| Average assets under management | $ | 32,046 | Â | Â | $ | 32,598 | Â | Â | $ | 30,697 | Â | Â | -1.7 | % | Â | 4.4 | % | Â |
| Â | Â | Â | Â | Â | Â | Â | Â | Â | Â | Â | ||||||||
| Â | Â |
| Contact: | Kieran Caterina |
| Â | Chief Accounting Officer |
| Â | (914) 921-5149 |
| Â | Â |
| Â | For further information please visit |
| Â | www.gabelli.com |
| Â | Â |
Photos accompanying this announcement are available at:
https://www.globenewswire.com/NewsRoom/AttachmentNg/fdf70333-2c19-43f2-ac7e-f41e523355c5
https://www.globenewswire.com/NewsRoom/AttachmentNg/14973722-0885-4fca-8e88-5fad950be53c