
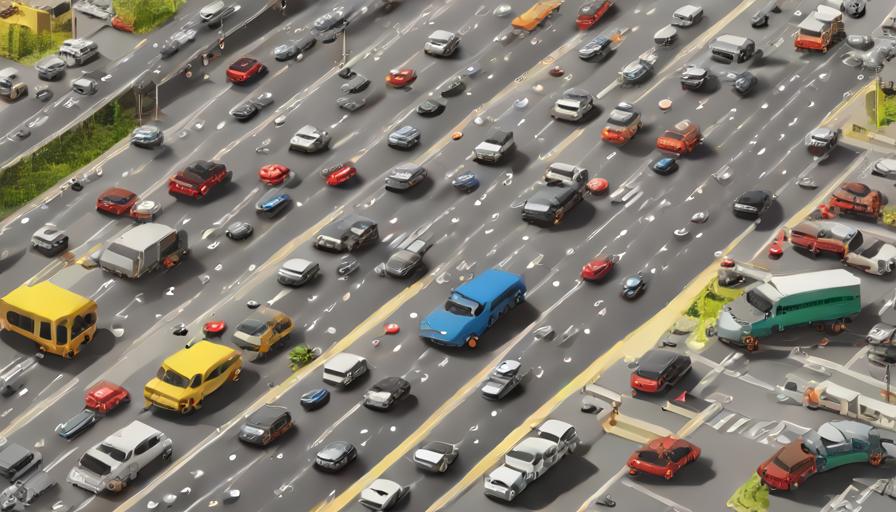
- Traffic congestion adds an average of 45 minutes of delay per commuter daily in major U.S. cities.
- In 2023, U.S. roadways recorded roughly 277 million vehicle trips per day, a 2.5 % rise from the previous year.
- Adaptive traffic signals can cut travel time by 10‑18 % and cost as little as $250,000 per mile to install.
Traffic refers to the movement of vehicles, pedestrians, and data across transportation networks, and it directly impacts travel time, safety, and emissions. In most urban areas, traffic congestion adds an average of 45 minutes of delay per commuter each day, according to the 2022 INRIX Global Traffic Scorecard.
What is traffic and why does it matter?
Traffic encompasses all forms of movement on roads, railways, and even digital networks. It matters because excessive traffic leads to longer travel times, higher fuel consumption, increased greenhouse‑gas emissions, and a greater risk of accidents. Policymakers use traffic data to prioritize infrastructure investments and to evaluate the effectiveness of congestion‑mitigation policies.
Types of traffic
- Vehicular traffic: Cars, trucks, buses, and motorcycles that use roadways.
- Pedestrian traffic: Foot traffic on sidewalks, crosswalks, and shared‑space zones.
- Data traffic: Information packets transmitted over broadband and cellular networks, often influencing navigation apps.
How many vehicles travel on U.S. roads each day?
According to the Federal Highway Administration, approximately 277 million vehicle trips were recorded per day in the United States in 2023. This figure represents a 2.5 % increase from 2022 and reflects growing suburban commuting patterns.
Peak‑hour travel statistics
During the 7 am–9 am and 4 pm–6 pm windows, average travel speeds drop to 32 mph on highways that are designed for 65 mph, illustrating a 51 % reduction in efficiency. The same periods account for 60 % of all reported traffic incidents.
What causes traffic congestion?
Congestion arises when demand exceeds roadway capacity. Key contributors include:
- High population density in metropolitan cores.
- Insufficient public‑transport alternatives.
- Accidents, road work, and weather‑related disruptions.
- Peak‑hour commuter spikes that exceed the designed vehicle‑per‑hour (VPH) capacity.
How bottlenecks amplify delays
When a single lane closes for construction, the effective capacity can drop by up to 30 %. According to the Texas A&M Transportation Institute, each lane reduction adds roughly 0.8 minutes of delay per vehicle per mile of blockage.
How can cities reduce traffic congestion?
Effective congestion mitigation blends engineering, policy, and technology. Below is a concise comparison of five common strategies.
| Strategy | Typical Cost (USD per mile) | Average Travel‑time Reduction | Implementation Time |
|---|---|---|---|
| Dedicated bus lanes | $1–2 million | 15–25 % | 1–3 years |
| Congestion pricing | $0.5–1 million (administration) | 20–30 % | 2–4 years |
| Adaptive traffic signals | $250–500 k | 10–18 % | 6–12 months |
| Car‑pool incentives | $100–300 k | 5–12 % | 1 year |
| Bike‑share networks | $300–600 k | 3–8 % | 1–2 years |
Case study: London’s congestion charge
Since its introduction in 2003, London’s congestion charge has reduced central‑city traffic by 15 % and cut CO₂ emissions by 12 % per vehicle, according to Transport for London.
What is traffic data and how is it collected?
Modern traffic monitoring relies on a mix of fixed sensors, satellite imagery, and crowd‑sourced smartphone data. Loop detectors embedded in pavement count vehicle axles, while Bluetooth scanners capture anonymized device IDs to estimate travel speeds across corridors.
Key data sources in 2024
- National Highway Traffic Safety Administration (NHTSA) crash reports – >5 million incidents recorded annually.
- Google Maps real‑time traffic layer – aggregates ~150 billion location points per day.
- City‑wide CCTV networks – many municipalities now use AI to classify vehicle types.
Future trends in traffic management
Artificial intelligence and connected‑vehicle technology are reshaping how traffic is controlled. Predictive analytics can forecast congestion 30 minutes ahead, allowing traffic‑control centers to pre‑emptively adjust signal timing.
Autonomous vehicles and platooning
By 2030, the International Transport Forum estimates that autonomous‑vehicle platoons could increase highway capacity by up to 40 % because following distances shrink to 0.5 seconds instead of the traditional 2‑second rule.
Mobility‑as‑a‑service (MaaS) platforms
Integrated apps that bundle ride‑hailing, bike‑share, and public‑transit options aim to reduce single‑occupancy trips. A 2023 study in Stockholm showed a 12 % reduction in peak‑hour car trips after a city‑wide MaaS pilot.
In summary, understanding the root causes of traffic, leveraging accurate data, and applying targeted mitigation measures can dramatically improve travel efficiency, safety, and environmental outcomes for today’s growing urban populations.
Economic costs of traffic congestion
Beyond the personal inconvenience of lost time, congestion imposes a heavy fiscal burden on national economies. The Texas A&M Transportation Institute estimates that U.S. commuters collectively lose over 3 billion hours each year, translating to roughly $160 billion in wasted fuel and productivity. Urban freight operators report an average increase of 12 % in delivery times during peak periods, forcing many companies to expand their fleets or raise shipping rates. Moreover, property values near chronic bottlenecks tend to stagnate, while neighborhoods with reliable transit corridors often see a 5–10 % premium on real‑estate prices.
Environmental consequences of high‑volume traffic
Each additional vehicle mile traveled contributes directly to air‑quality degradation. In 2023, the EPA linked traffic‑related emissions to over 200 million metric tons of CO₂, accounting for roughly 15 % of the United States’ total greenhouse‑gas output. Nitrogen oxides (NOx) and particulate matter (PM2.5) from stop‑and‑go traffic are especially harmful in densely populated downtown districts, where they exacerbate asthma rates and other respiratory conditions. Strategies that cut vehicle‑kilometers—such as dynamic lane‑use controls or expanded bike infrastructure—can therefore deliver measurable health benefits alongside climate gains.
Emerging policy tools and planning frameworks
City planners are increasingly adopting a suite of data‑driven policies to address both demand and supply factors:
- Travel‑demand management (TDM): Incentives for telecommuting, flexible work hours, and staggered school schedules that flatten peak loads.
- Zero‑emission zones (ZEZ): Restrictions on internal‑combustion vehicles within city centers, paired with subsidies for electric‑vehicle charging.
- Dynamic pricing: Real‑time congestion fees that adjust based on actual traffic conditions, encouraging drivers to shift trips to off‑peak times.
Smart corridor initiatives
Several metropolitan areas have launched “smart corridors,” where connected‑infrastructure—such as V2I (vehicle‑to‑infrastructure) beacons, adaptive ramp metering, and AI‑powered incident detection—communicates directly with equipped vehicles. Early pilots in Seattle and Copenhagen show a 9 % reduction in average travel time and a 13 % decrease in emissions along the tested routes.
By integrating economic analysis, environmental stewardship, and cutting‑edge technology, the next generation of traffic‑management strategies promises to make urban mobility faster, cleaner, and more equitable for all users.
Frequently Asked Questions
What is the most effective way to reduce traffic during rush hour?
Congestion pricing has shown the greatest impact, cutting peak‑hour traffic by 20‑30 % in cities like London and Singapore, while also generating revenue for public‑transport improvements.
How do adaptive traffic signals work?
They use real‑time sensor data and AI algorithms to adjust green‑light lengths based on current vehicle flow, improving corridor speeds by up to 18 % without building new roads.
Can autonomous vehicle platoons really increase road capacity?
Yes. By reducing safe following distances to half a second, platoons can raise highway throughput by up to 40 %, according to the International Transport Forum’s 2030 forecast.
What role does bike‑share play in traffic management?
Bike‑share programs provide a low‑cost alternative for short trips; cities that expanded bike‑share saw 3‑8 % reductions in car traffic during peak periods, especially when paired with protected lanes.
How accurate is crowd‑sourced traffic data from smartphones?
Google Maps aggregates more than 150 billion location points daily, delivering speed estimates accurate within 5 % of ground‑truth sensor readings, making it a reliable source for real‑time routing.